
HMRC has disclosed information regarding the count of companies filing for research and development (R&D) tax credits and the projected value of these claims for the fiscal year 2021-22.
There have been many reviews of the data, which shows April 2021 to March 2022 claims for SME are rising, HMRC are spending more money than ever, with a total payout of £7.57 billion across the SME and RDEC schemes, covering 90,315 claims thus far. The last completed period, for which data will not change now, was £6.87 billion for 74,535 claims.
Our technical team has meticulously examined the data, presenting detailed insights into HMRC’s trajectory and conducting a comprehensive analysis across various industry sectors.
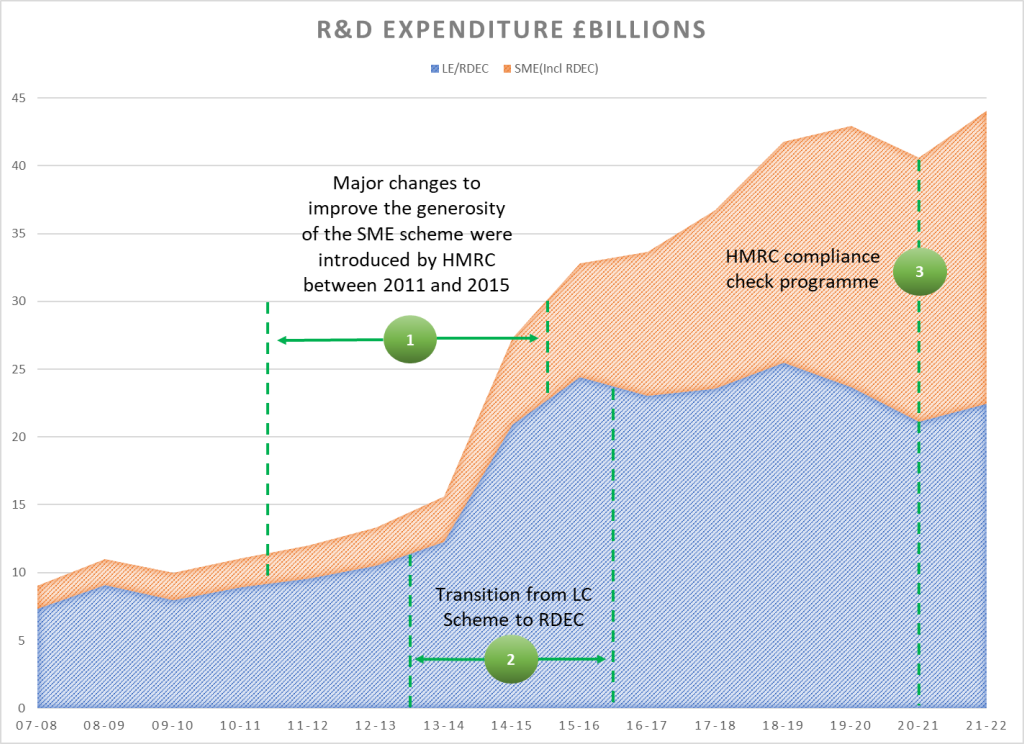
In 2013-2014, the equivalent figures stood at £1.64 billion for 19,335 claims. Therefore, resulting in more than a 460% increase in claims and cost to HMRC for these schemes. This surge in claims has placed HMRC under immense pressure to demonstrate they are in control of the R&D tax credits schemes. Prior to 2021, as widely highlighted in the media and parliamentary committees, it was evident that HMRC lacked control over these schemes.
During the period 2011 through to 2015 the Government and HMRC made the SME R&D tax incentives a lot more appealing to companies. This involved escalating rates from 75% to 130% and boosting cash-in rates for losses to 14.5%, all while lowering the corporation tax rate. However, the reduction in the corporation tax rate subsequently decreases the advantage for profitable companies making R&D tax credit claims under the SME scheme.
| 01/04/2011 | 01/04/2017 | |
| Profitable company | 21% | 21% |
| Cashed in Losses company | 27.3% | 33.3% |
This rendered R&D claims highly appealing for companies, particularly given HMRC’s minimal scrutiny at the time. Starting in 2014, this was identified, prompting companies to increasingly file claims under both the SME and RDEC schemes.

HMRC’s intensified scrutiny of R&D tax credits to identify boundary-pushing activities and fraud did not start until 2021. A noticeable decline in R&D expenditure is evident on the graph for the year 2020/21, however, it is likely attributable to COVID-related factors.
Another noteworthy observation is the eligible spend under the RDEC scheme, represented in blue on the graph, for Large Company spend only (excluding SMEs claiming under RDEC) has flatlined since 2016, with no significant increase in spend since then. Although there might be a slight rise in recent years due to increased claim submissions, it seems that the RDEC scheme for Large Companies in the UK is not effectively stimulating additional R&D spending, contradicting the scheme’s intended purpose.
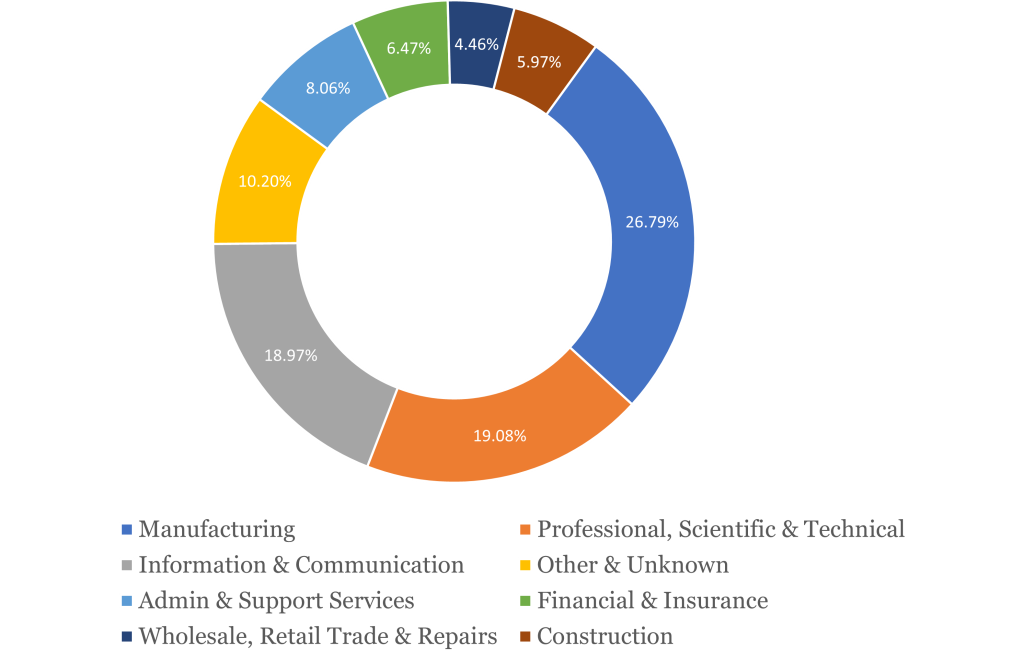
The sectors with the largest claims remain manufacturing, professional, scientific & technical and information and communication, which represents 64.8% of all claims.

The average claim in these three top sectors varies a little:
| Sector | SME | RDEC |
| Manufacturing | £47, 549 | £536,122 |
| Information & Communication | £66, 629 | £532, 710 |
| Professional, Scientific & Technical | £73, 944 | £836, 957 |
However, these are not the sectors with the highest average claims. Arts, Entertainment and Recreation registered 860 SME claims, boasting an average claim value of £87,209, surpassing any of the big 3 sectors. Even the RDEC claims averaged £1.16m, significantly larger than those of these 3 sectors. It appears highly unusual for a sector like Arts and Entertainment would make such substantial claims. Moreover, the number of companies in this sector claiming tax credits is below 1% of all Companies House-listed trading entities. It’s a small cluster of companies making remarkably large claims!
The distribution of companies making claims across sectors varies significantly. For instance, Arts, etc, accounts for 0.8% of companies, while this ranges from 7.8% in manufacturing to 0.1% in real estate. One sector that was particularly surprising is Professional Scientific and Technical, with only 1.9% of companies making claims.
| Sector | % of companies making a claim |
| Manufacturing | 7.8% |
| Information & Communication | 4.5% |
| Water, Sewerage & Waste | 3.8% |
| Agriculture, Forestry, Fishing | 3.6% |
| Mining & Quarrying | 3.4% |
| Professional, Scientific & Technical | 1.9% |
| Electricity, Gas, Steam and Air Conditioning | 1.8% |
| Construction | 1.6% |
| Admin & Support Services | 1.5% |
| Wholesale & Retail Trade, Repairs | 1.1% |
| Health & Social Work | 0.9% |
| Financial & Insurance | 0.9% |
| Education | 0.8% |
| Other services activities | 0.8% |
| Arts, Entertainment & Recreation | 0.8% |
| Public Admin, Defence & Social Services | 0.7% |
| Transport & Storage | 0.6% |
| Accommodation & Food | 0.4% |
| Real Estate | 0.1% |
The Professional Scientific and Technical sector includes a broad spectrum of trades, ranging from accountancy, bookkeeping, and audit, extending through PR and management consultancy to the more technically inclined fields where one might expect R&D claims, such as architecture, engineering design for industrial processes, technical consultancy, and other engineering activities. However, this wide-ranging category also includes advertising, media, photography, translation, and then cycles back to more technical areas like surveying, environmental activities, and even veterinary services. This diverse mix skews heavily towards professional services rather than scientific and technical pursuits, thereby explaining the relatively low rate of 1.9% of companies claiming R&D tax credits.
Get in touch with
Ian Davie
T: 01332 819740
E: info@tbat.co.uk